Observe the system
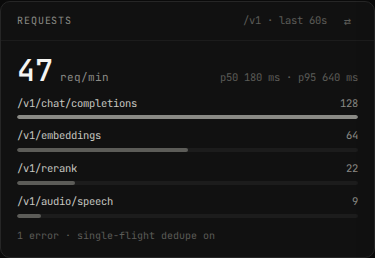
hal0 gives you three log/activity surfaces, each with a different lifetime and a different CLI verb: per-slot runtime logs, per-agent provisioning logs, the API’s own systemd journal, and — separately from all of those — the durable Activity/Audit log. The dashboard also rolls request traffic up live:
Slot logs
Section titled “Slot logs”hal0 slot logs agent # last 200 lineshal0 slot logs agent --follow # -f, live SSE tailhal0 slot logs agent --lines 1000 # -n, more historyLogs come from the slot’s hal0-slot@<name>.service journal. Equivalent
raw journalctl, if you have shell access on the host:
journalctl -u hal0-slot@agent.service -fAgent provisioning logs
Section titled “Agent provisioning logs”hal0 agent log hermeshal0 agent log hermes --phase provisionThese are per-phase flat files under the agent’s state directory, not a
systemd journal — a different surface from the agent’s own runtime
output, which lives in hal0-agent@hermes’s journal via systemctl the
same as any other unit.
The API’s own log tail
Section titled “The API’s own log tail”hal0 doctor logs # hal0-api's journal, last 200 lineshal0 doctor logs --followhal0 doctor logs --unit hal0-api --level warning --since '5min ago'This is a thin client over GET /api/logs / /api/logs/stream — the
same endpoint the dashboard’s Logs panel reads, so the CLI and dashboard
never disagree.
| Query param | Default | Notes |
|---|---|---|
unit |
— | Required. The systemd unit, e.g. hal0-api or hal0-slot@agent. |
n |
200 |
Trailing lines, 1–5000. |
since |
— | A journalctl --since value (ISO timestamp or '5min ago'). |
level |
— | Filter to this priority and higher severity. |
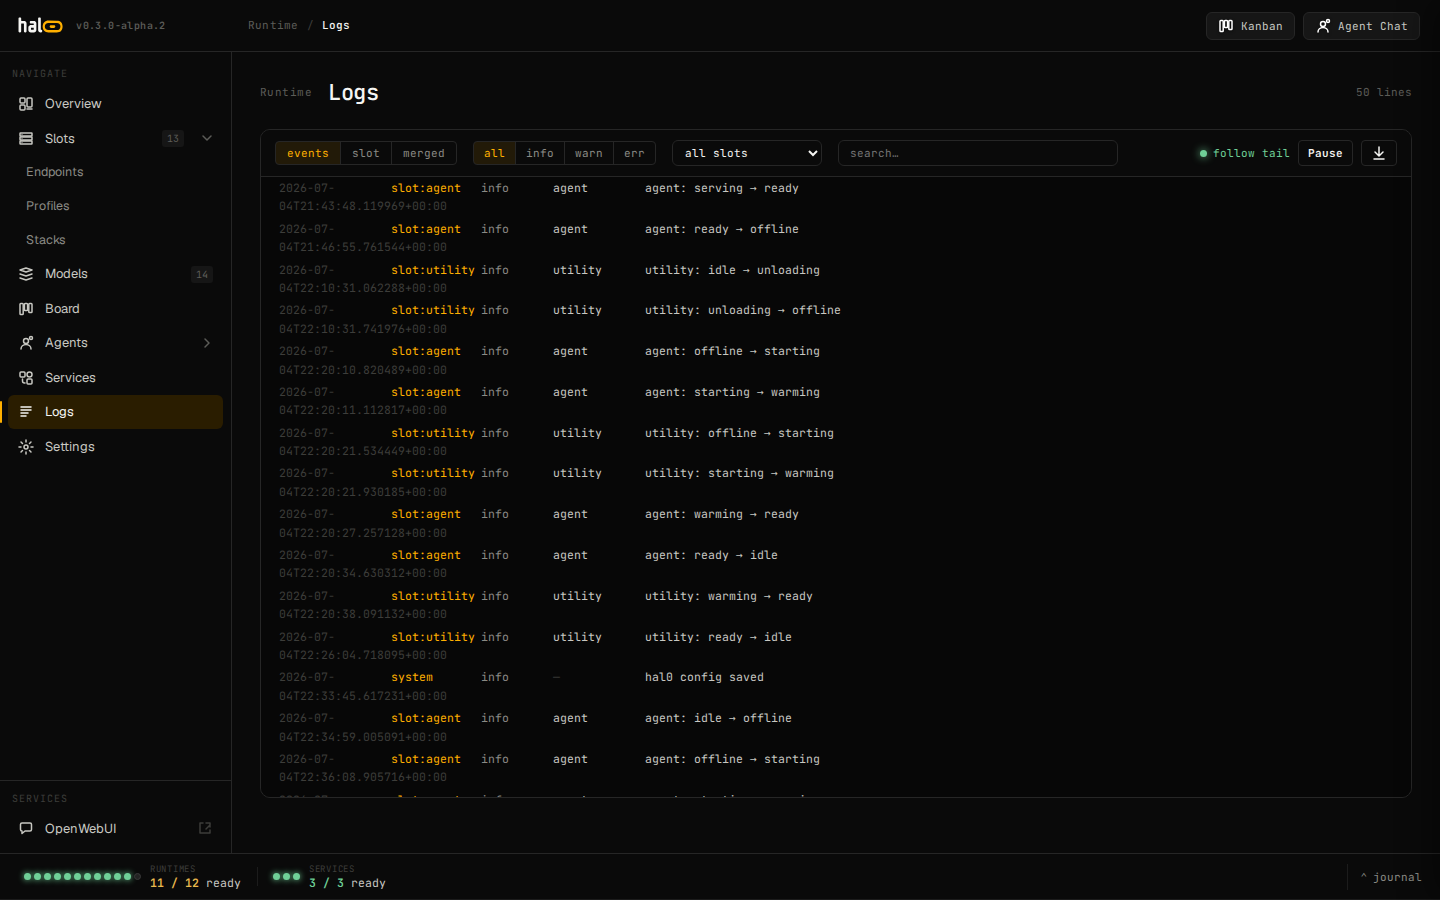 The dashboard Logs panel streams journal output for any hal0 unit in real time.
On a host without journalctl (e.g. CI), the endpoint returns an empty
lines array plus a hint rather than erroring.
The dashboard Logs page (unified logs/events)
Section titled “The dashboard Logs page (unified logs/events)”The dashboard’s Logs page reads from two different backends behind one
channel selector — events / slot / merged:
events— the structuredGET /api/journalfeed (hal0’s internal EventBus: slot state transitions, config changes, and the like), with server-side filterssource,slot,level(exact match),q(substring),since(id cursor),limit(1–500, default 200).slot— the raw per-slot journald tail (GET /api/slots/{name}/logs[/stream], the same datahal0 slot logsreads), picked from a slot dropdown. Aquietfilter (on by default) drops idle heartbeat spam.merged— both channels together.
The durable Activity and Audit log
Section titled “The durable Activity and Audit log”journald is a volatile tail. For a permanent record of what changed,
hal0 keeps a SQLite audit store (/var/lib/hal0/activity.db, preserved
across updates). It records every config-mutating user action and every
system state change — each with a before/after snapshot and a
success/failure outcome.
There’s no hal0 activity CLI verb — this is a dashboard/API-only
surface:
curl 'http://localhost:8080/api/activity?limit=200'The response is {"records": [...], "next_since": <id>, "epoch": "..."}.
Poll with ?since=<next_since> to page forward. Server-side filters
(combine freely):
| Filter | Values |
|---|---|
since |
id cursor — return records newer than this id. |
category |
free-form category string. |
action |
free-form action name. |
severity |
info, warn, error, ok. |
outcome |
ok, error, pending. |
actor |
the agent / actor that performed the action. |
kind |
action (a user action) or event (a system state change). |
search |
full-text match. |
limit |
1–1000 (default 200). |
Stream the durable backfill then a live tail:
curl -N 'http://localhost:8080/api/activity/stream?kind=action'Export the filtered history as a file download:
curl 'http://localhost:8080/api/activity/export?fmt=csv' -o hal0-activity.csvcurl 'http://localhost:8080/api/activity/export?fmt=json' -o hal0-activity.jsonSee also
Section titled “See also”- Manage slots — the slot lifecycle whose transitions show up in the activity log.
- Edit configuration — config changes are audited.
- Security — the LAN-open posture and what is (and isn’t) logged.